
This work (other than the webtool) has been published in this RIVM brochure
Calculation method background
We have used calculation methods from Rajagopalan et al (2021), and combined this with the data provided by the IEA factsheet using the updated data from the IEA PVPS life cycle inventory. We perform the analysis on a mono-Si PV system, since it is expected this technology will dominate the market in the short term future, and environmental data availability is much higher compared to other technologies.
In the IEA factsheet, for span of 30 years, the total carbon emissions per generated kWh for a mono-Si PV
system are 42.5 g CO2-eq, with the following scope and conditions:
- System: 3 kWp PV system, flat-roof installation in Europe, including panel, cabling, mounting structure, inverter and system installation
- Expected lifetime: 30 year for panels, 15 year for inverters
- Irradiation: 975 kWh/kWp
- Efficiency: 19.5% efficiency for mono-Si technology
- Degradation: 0.7% linear yield degradation
- Life cycle stages: manufacturing, transport, installation, use and end-of-life stage
- Global value chain: the LCA takes into account the global value chain behind the production of a PV system installed in Europe, and includes market mixes for sourcing regions for wafers, photovoltaic cells and panels.
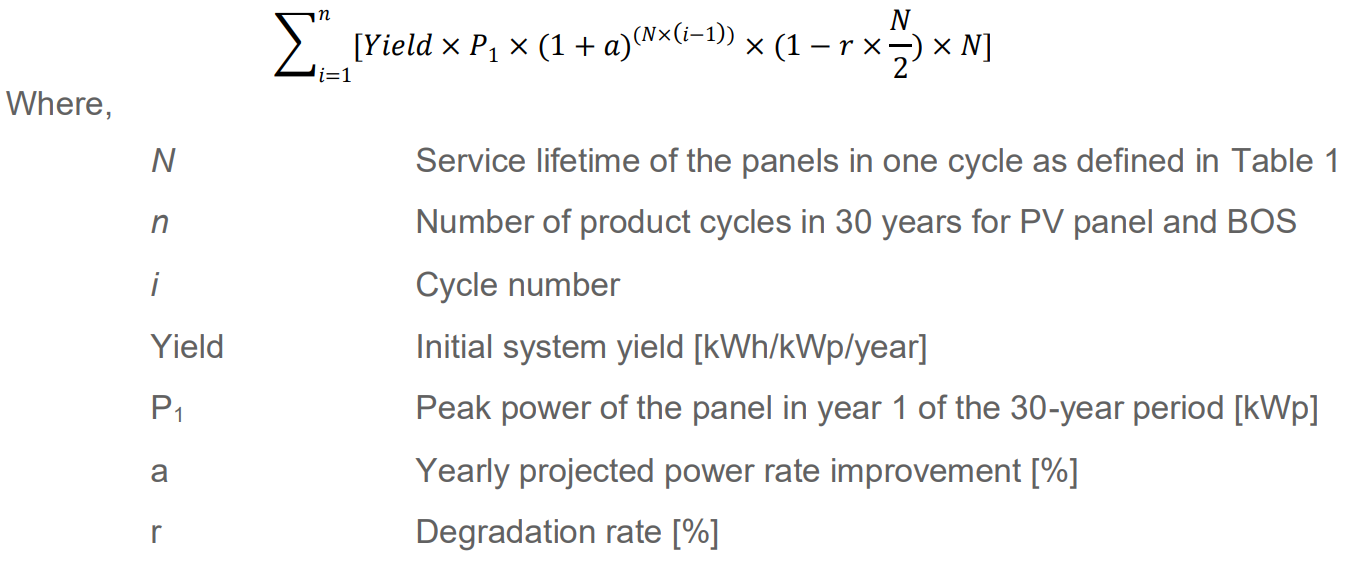
Rajagopalan et al (2021) provides an equation to calculate the yield for a PV system over a span of 30
years, including the effect of replacing panels before its expected lifetime (equation 1). With this
equation, we calculate the 30 year yield of the PV system described earlier: 78536 kWh. Together with the
carbon coefficient, we find that this system takes (42.5 g CO2-eq /kwh * 78536 kWh = ) 3337 kg CO2-eq per
panel (to produce, maintain, and discard the panel by recycling).
For the same system, we can calculate the carbon coefficient for an installation in the Netherlands. The
irradiation in the Netherlands is around 1044 kWh/kWp, so this
results in a
baseline of 39.7 g CO2-eq/kWh.
This result fall within the range of carbon coefficients calculated
by TNO, being 29 g CO2-eq/kWh and 55 g
CO2-eq/kWh for a system produced with a European and Chinese energy mix profile, respectively. This system
and its performance forms the baseline for this study.
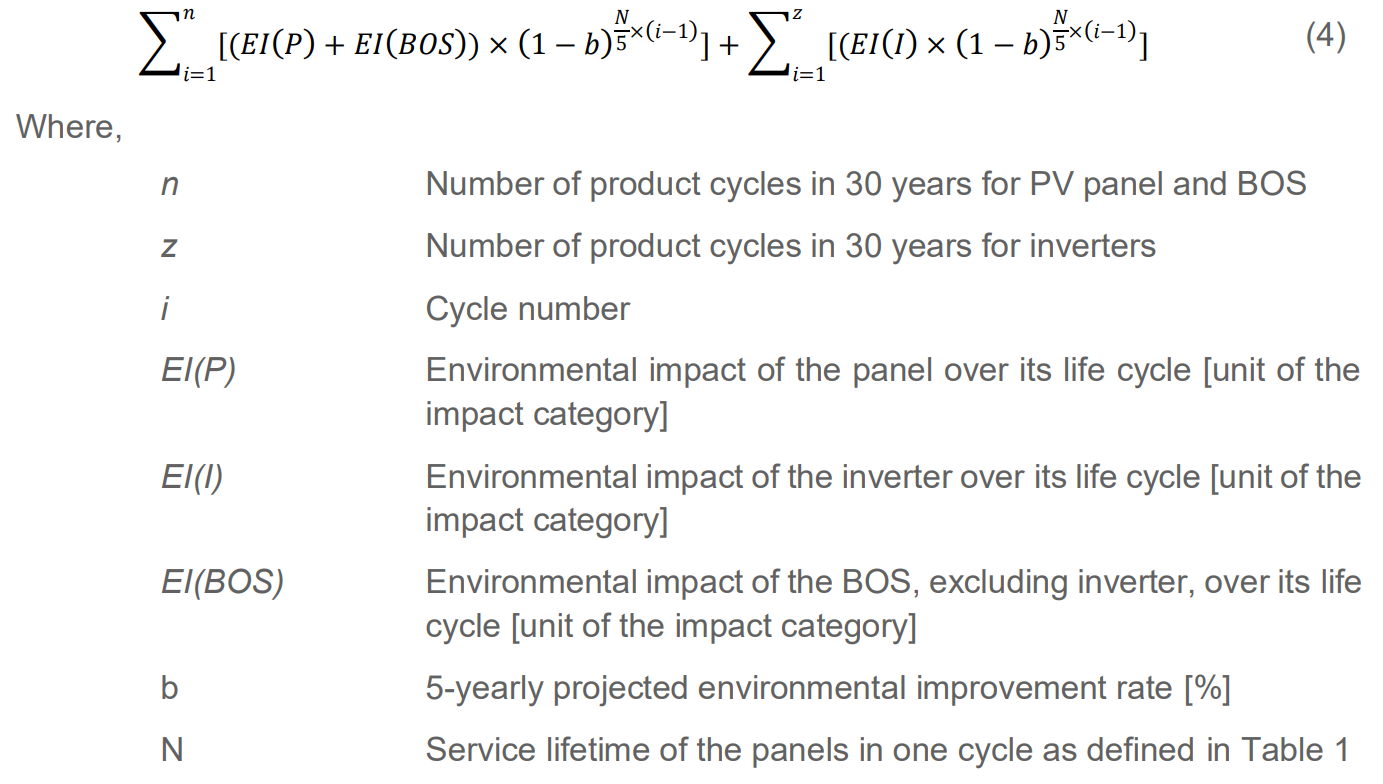
With the given baseline, we can assess various replacement scenarios based on the equation 1 in
combination with the equation 2. In replacement scenarios, where the system will be
replaced with newer panels before its expected lifetime, it is necessary to take into account future
technological development (especially for the rapidly evolving PV technologies). Newer panels are usually
more efficient, and can have a lower carbon profile over its life cycle due to efficiencies in production or
higher circularity (e.g. higher material recycling or higher modularity). Equation 1 includes
a, the yearly projected power rate improvement (in %), which is expected to be around 1.4%.
Equation 2 includes b, the 5-yearly projected environmental improvement rate (in %), which
is
expected to be
around 5% every 5 years. With equation 2 we calculate the total carbon footprint associated with the used PV
system over 30 years. With equation 1 we calculate the total electricity generated over 30 years. We compare
the performance by the functional unit g CO2-eq/kWh, so; dividing the result of the total carbon footprint
with the total electricity yield.